Best Bath Store
All Natural Blend of 14 Herbs Gentle Cleanse- $20 Off Colonix Now! Use Promo Code 20J
Amberen - Breakthrough Menopause Treatment
728x90
Custom Search
Showing posts with label doppler study of carotid and vertebral vessels. Show all posts

Tuesday, July 13, 2010

Internal Jugular Vein Phlebectasia:


The above ultrasound/ Doppler images show a typical ectasia of the Rt. IJV in a young child. The diameter of the Rt. internal jugular vein is seen to increase from 8mm. (at rest) to almost 23mm. (on Valsalva). Images are courtesy of Ravi Kadasne, MD, UAE.

Ectasia of Internal Jugular vein:


This was a young adult male with complaint of small swelling in the left side of neck and mild dysphagia. On Color Doppler examination of the vessels of the neck, the right side showed normal diameter and flow in the right internal jugular vein and common carotid artery (see image on top left). However the left jugular vein showed a fusiform dilatation of the lower part of the vessel (close to its origin, ie: the proximal portion). Here, the vessel measured almost 12 to 14 mm. in diameter at rest. On deep inspiration and Valsalva maneuver, the rise in intrathoracic pressure resulted in diameter of the Internal jugular vein measuring 15 to 17 mm. (see image at bottom left). Compared to the the IJV on the right side the left IJV (internal jugular vein) also showed marked turbulence of flow both on Color Doppler imaging (see images on bottom left) and spectral Doppler waveform. The ultrasound/ Color Doppler images/ findings suggest Ectasia of the left Internal Jugular vein.
Reference: http://www.jultrasoundmed.org/cgi/reprint/18/6/411.pdf (free article and images).

Carotid artery plaque:


This middle aged male patient had a recent partial stroke affecting the left side of face and left upper limb. The B-mode ultrasound images of the right Common carotid artery show an atheromatous plaque of the lower third of the vessel. This plaque is non calcific and shows no evidence of ulceration. The Color Doppler images of the common carotid artery show no significant obstruction to blood flow in this artery. Possibly, there might have been a small embolic episode some time ago resulting in cerebral ischemia on this side.

Ultrasound and Color Doppler imaging of vertebral artery:


The vertebral arteries course through the foramen of the transverse processes of the cervical vertebrae (from C-6 upwards). The vertebral artery is seen sonographically, between the transverse processes of the cervical vertebrae, as segments. The part within the transverse processes is hidden by the bone. The normal vertebral artery (see color Doppler images above) shows the same direction of flow (and hence the same color as the common carotid artery anterior to it).

Intima-media thickness (IMT) of carotid artery:


The carotid artery/ arteries consist of 3 layers- the intima (the inner most thin layer of endothelium), the middle layer or media (formed by smooth muscles) and the outermost layer- the adventitia (formed by loose connective tissue. On grey scale sonography, the long section ultrasound image produces 2 parallel lines - the inner most line is bright (echogenic), thin and corresponds to the intima; the media is the dark line just outer to the intima. The measurement of the total thickness (intima media thickness) or IMT helps assess the arterial wall for presence of plaques or thickening. Normal common carotid artery thickness should be less than 0.9 mm. In the ultrasound images above, the IMT measures 0.6 to 0.7 mm. (normal).

Another sign to identify the ECA (external carotid artery):

ECA- systole:
ECA- early diastole
ECA and ICA - systole- color flow present:


ECA- late diastole- fades out:


ECA- poor flow in early diastole


ECA- no flow during late diastole: absent color flow signal


A very useful sign to identify the normal ECA is looking for flicker or fading out of the Color Doppler flow in the ECA during diastole. This is due to the very low absent flow in the ECA during diastole, as opposed to the ICA and CCA, both of which show significant flow during diastole. As a result, the ECA flickers on during cardiac systole (see Color Doppler images of the ECA and ICA above) and fades out (absent flow) during diastole). 3 of the Color Doppler images above are axial sections through the ECA and ICA while the other 3 images show the ECA and ICA just emerging from the bifurcation of the CCA (common carotid artery). All images by Joe Antony, MD. Machine used here is the Toshiba Nemio-XG ultrasound system.

The temporal tap sign of the (ECA) External carotid artery:


An important method of differentiating the ECA from the ICA is the "temporal tap" sign. Tapping the temporal artery (a branch of the ECA) at the level of the zygomatic arch, just anterior to the external ear, produces fluctuations in the spectral waveforms of the ECA. This is seen in the above ultrasound images showing vertical dips and peaks during the diastolic flow. (Compare the Doppler images on left (without the tap) with the image on right (during temporal tap)).

Doppler waveform of normal ECA (External carotid artery):


The ECA (right ECA here) shows very high (compared to ICA) PSV values and hence a sharp systolic peak and rather poor flow during diastole (seen as low EDV or end diastolic velocity). The PSV (Vmax) in this case is = 105/cms./sec. The normal range of PSV (peak systolic velocity) for the ECA is from 77 cms./sec. to 115 cms./sec.


Spectral Doppler waveforms of the normal ICA (internal carotid artery):


The Doppler images above show the spectral waveform of the normal ICA (Internal carotid artery-Rt.). The systolic peak in the ICA is broader than the ECA or even the CCA. Also, note the high (and persistent) diastolic flow. The normal PSV (Vmax in our image), ranges from55 to 88 cms./sec. in the ICA. This is true for the post bulbar (part distal to the carotid bulb) part of the ICA. (In our case the PSV or Vmax = 68 cms./sec).

Spectral Doppler waveform of the normal Common carotid artery (CCA):


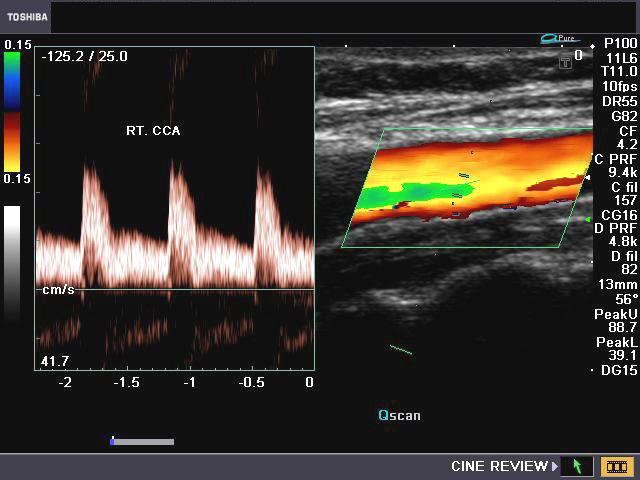
The above images (Rt. CCA) show moderately broad systolic peaks and moderate diastolic flow in diastole. The peak systolic velocity (PSV or V-max) is also in a range between that of the ICA and ECA. This is the typical appearance of the waveform of the CCA. Normal PSV for the CCA is usually less than 100cms./sec. (In this case, the PSV= 94 cms./sec.). The PSV in the CCA increases towards its proximal part (ie: towards the aorta).

The above color Doppler images show a cross section through the bifurcation of the (Rt.) common carotid artery into its two main branches: 1) Rt. ECA- the external carotid artery 2) Rt. ICA- the internal carotid artery. The image on right shows a section just above the bifurcation. IJV= the internal jugular vein (seen in blue color). Note that the ECA is more anterior and medial to the ICA. Also, the ICA (internal carotid artery) is larger than the other branch- the ECA.


The above Color Flow images show a long section through the Rt. CCA (common carotid artery) bifurcating into the ICA (internal carotid artery) and ECA (external carotid artery). Note the wider caliber of the ICA. (arrow points to the bifurcation).


These ultrasound images of a young, asymptomatic adult female patient reveal multiple calcific plaques of the common carotid arteries of both sides. The intimal plaques measure 1.5 to 4mm. in size. These sonographic images are diagnostic of dystrophic calcification of the intima of the carotid arteries. Such lesions are very unlikely to cause stroke or thromboembolic events and are hence of little significance. All ultrasound images taken with a Nemio - XG ultrasound system, by Joe Antony, MD, India.
References:1) http://www.evtodayarchive.com/03_archive/0902/et0902_15.html (a good article.. free).

Saturday, July 10, 2010


(a) Spectrum from the external carotid artery shows a high-resistance waveform with reversal of flow in early diastole. (b) Spectrum from the internal carotid artery displays a low-resistance waveform with continuous forward diastolic flow and with a spectral line that ascends farther above the baseline than that from the external carotid artery. (c) Spectrum from the common carotid artery represents a composite of waveforms from the external carotid artery and internal carotid artery but more closely resembles the waveform from the internal carotid artery, because 80% of the common carotid artery flow goes into the internal carotid artery.
(d) Spectrum from the vertebral artery shows low-resistance forward flow above the baseline throughout diastole. Spectral broadening is due to the small diameter of this vessel.