Best Bath Store
All Natural Blend of 14 Herbs Gentle Cleanse- $20 Off Colonix Now! Use Promo Code 20J
Amberen - Breakthrough Menopause Treatment
728x90
Custom Search

Saturday, July 10, 2010


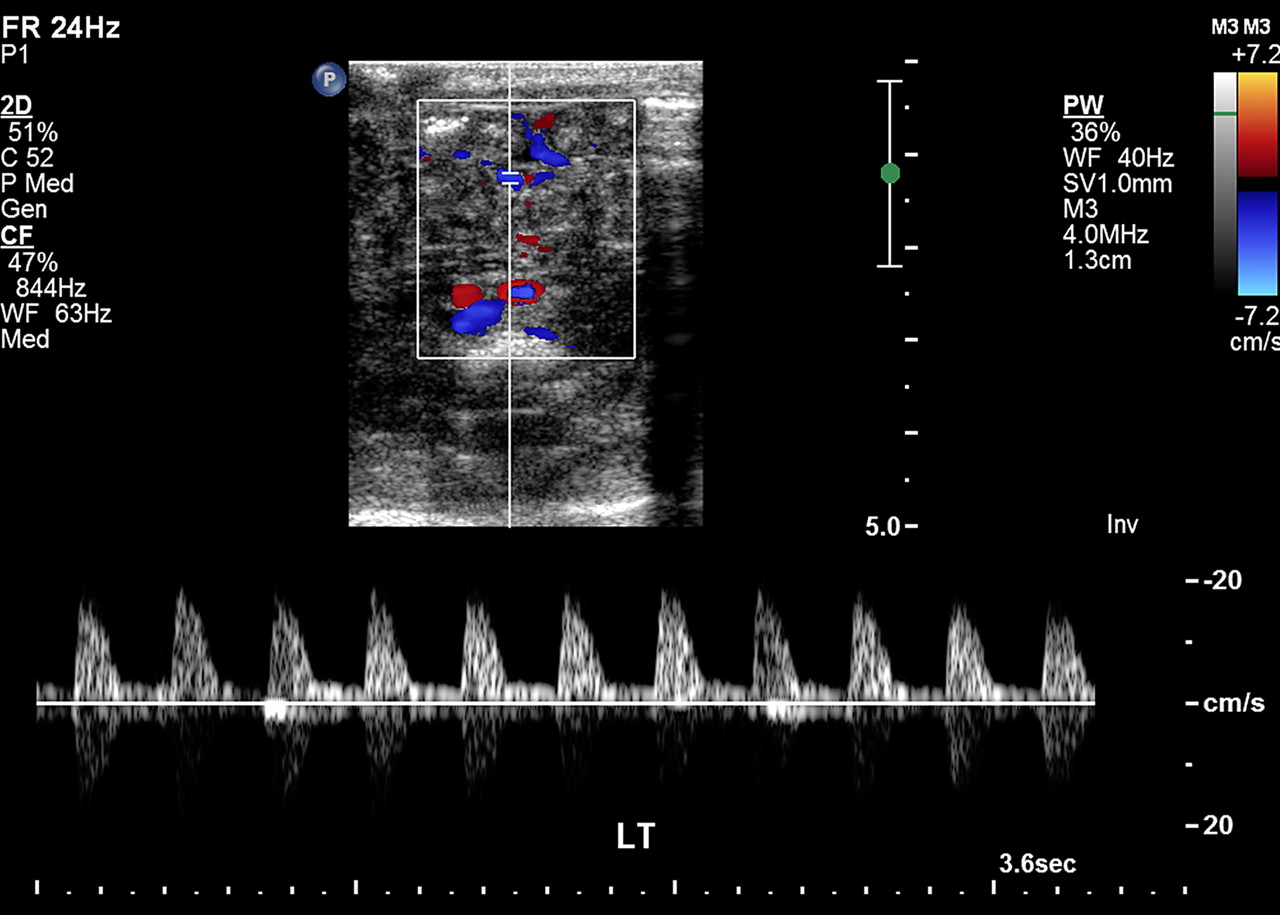
Normal spectral waveforms from lower limb veins. (a) Common femoral vein waveform obtained during breath holding in an 11-year-old boy shows a, S, v, and D waves. (b) Waveform from the popliteal vein in an 11-year-old boy shows a reduced flow velocity during inspiration and an increased velocity during expiration. (c) Posterior tibial vein waveform from an 11-year-old boy shows phasic variations from respiration with mild superimposed undulation from right atrial pressure changes.
The phasic pattern of flow in lower limb veins reflects a combination of both cardiac and respiratory movements (3). Normally, all four waves that represent right atrial changes can be seen in the spectral line (Fig 10). If the S, v, and D waves are completely above the baseline and the a wave is either completely above the baseline or descends less than 5 cm/sec below it, normal antegrade flow is considered to be present. A deeper descent of the a wave below the baseline is indicative of retrograde or pulsatile flow, a pattern suggestive of increased right atrial pressure (12).
During inspiration, increased intraabdominal pressure results in a reduction of venous return from the lower limbs, which in turn leads to a decrease in the velocity or amplitude of the waveform. During expiration, flow velocities in the lower limb veins increase (3). The maximum flow velocity in femoral veins in adults is 12–30 cm/sec (13).


. Normal spectrum from the superior sagittal sinus in a 10-week-old-boy shows a phasic waveform caused by pulsation from a nearby artery.


http://radiographics.rsna.org/content/28/3/691.full
a-
b-
Normal spectral waveforms from intracranial arteries. (a) Spectrum from the anterior cerebral artery in an 8-month-old girl shows a low-resistance waveform with continuous forward diastolic flow. (b) Spectrum from the posterior cerebral artery in a 6-day-old girl shows similar low resistance but less diastolic flow than in a. Note the complete filling of the spectral window because of the small diameters of these vessels.

Spectrum from a normal internal jugular vein in a 15-year-old girl shows a, S, v, and D waves that result from pressure changes in the right atrium.


http://radiographics.rsna.org/content/28/3/691.full


(a) Spectrum from the external carotid artery shows a high-resistance waveform with reversal of flow in early diastole. (b) Spectrum from the internal carotid artery displays a low-resistance waveform with continuous forward diastolic flow and with a spectral line that ascends farther above the baseline than that from the external carotid artery. (c) Spectrum from the common carotid artery represents a composite of waveforms from the external carotid artery and internal carotid artery but more closely resembles the waveform from the internal carotid artery, because 80% of the common carotid artery flow goes into the internal carotid artery.
(d) Spectrum from the vertebral artery shows low-resistance forward flow above the baseline throughout diastole. Spectral broadening is due to the small diameter of this vessel.


Plug Flow
In plug flow, all the red blood cells move at the same velocity, producing a flat wave front. The Doppler spectrum from this flow pattern is characterized by a narrow spectral line and a clear spectral window, which represent the absence of lower velocities (2). That waveform typically is seen in large arteries, such as the aorta.

Laminar Flow
In laminar flow, peripheral red blood cells move at a slower rate than central red blood cells do, because of friction offered by the vessel wall. This difference in flow velocities produces a parabolic wave front. In Doppler US spectra, laminar flow appears as broadening of the spectral line and filling of the spectral window . That waveform usually is seen in vessels with a diameter of less than 5 mm.

Turbulent Flow
Turbulent flow consists of a wide range of velocities, includes reversed flow components, and is readily appreciated as multiple colors on color Doppler images. In spectra, a turbulent flow pattern is visible as spectral broadening with components below the baseline. Turbulent flow is considered normal near vessel bifurcations (eg, the carotid bulb) but elsewhere is suggestive of abnormality .


http://radiographics.rsna.org/content/28/3/691.full
1-The resistive index (RI) can be calculated from spectral measurements by using the equation RI = (PSV − EDV)/PSV, where PSV is the peak systolic velocity and EDV is the end-diastolic velocity (1). The pulsatility index (PI) can be calculated by using the equation PI = (PSV − EDV)/MV, where MV is the mean flow velocity during the cardiac cycle.

2-The RI and the PI provide information about blood flow and resistance that cannot be obtained from measurements of absolute velocity alone. The effects of variation in vessel angulation and size are nullified in the calculation of these indexes .

http://radiographics.rsna.org/content/28/3/691.full
Diagram shows a normal arterial spectrum obtained with Doppler US, the parameters that define it, and the general terms used to describe it. PSV = peak systolic velocity, EDV = end-diastolic velocity.
The spectral window is the clear black zone between the spectral line and the baseline. Widening of the spectral line and filling of the spectral window is called spectral broadening. Spectral broadening is normally seen in the presence of high flow velocity, at the branching of a vessel, or in small-diameter vessels.


http://radiographics.rsna.org/content/28/3/691.full
Spectral waveforms obtained in the superior vena cava show phasic changes due to back-pressure from the right atrium and changes in amplitude with respiration. The a, S, v, and D waves all are visible. In the superior vena cava, flow velocity increases with inspiration, as negative intrathoracic pressure increases the venous return, and decreases with expiration. Maximum flow velocity in the superior vena cava in children is 60–80 cm/sec . In young adults, the reported maximum value is 32–69 cm/sec .


http://radiographics.rsna.org/content/28/3/691.full
Normal Doppler spectrum from the brachiocephalic vein in a 4-year-old girl shows a, S, v, and D waves from pressure changes in the right atrium, as well as reduced flow velocity during expiration.
Spectra obtained in the brachiocephalic vein are characterized by waveforms and respiration-related changes similar to those seen in spectra from the superior vena cava (Fig ).
Normal Doppler spectrum from the upper abdominal aorta in a 10-year-old boy shows a typical waveform characterized by a sharp increase in antegrade flow velocity during systole, followed by a reversal of flow in early diastole and then low-velocity antegrade flow in the remainder of diastole.

The normal Doppler flow pattern in the aorta is that of plug flow. In the aorta and iliac arteries, the flow is typically high resistance, with a sharp increase in antegrade flow velocity during systole followed by a rapid decrease that bottoms out in early diastole with a brief period of reversed flow (Fig 13). Low-velocity antegrade flow then resumes and continues for the remainder of diastole. Spectral Doppler analysis shows that the peak antegrade velocity decreases and the amount of retrograde flow increases as the flow progresses from the proximal aorta to the iliac vessels (17).


http://radiographics.rsna.org/content/28/3/691.full

Normal spectral waveforms in the superior mesenteric artery. (a) Fasting waveform from a 26-day-old neonate shows a high-resistance flow pattern. (b) Postprandial waveform from a 6-day-old neonate shows a low-resistance pattern with an increase in diastolic flow velocity.
The celiac artery has a high-resistance pattern at its origin, with a small amount of reversed flow in early diastole. Its distal portion and branches lose the reversed early-diastolic flow component, showing continuous low-resistance forward flow throughout the cardiac cycle .
With the body in a fasting state, flow through the superior mesenteric artery has a high-resistance pattern, with a small amount of reversed flow in early diastole (Fig a). After a meal, the PSV and diastolic velocities increase. The reversed diastolic flow disappears, a low-resistance pattern develops, and the systolic spectral peak broadens (Fig b).
Normal Doppler spectrum from the intrahepatic portion of the inferior vena cava in a 4-day-old boy shows the waves that result from right atrial back-pressure.

The waveform of the inferior vena cava varies according to the specific segment sampled. The flow in the proximal inferior vena cava is influenced by the activity of the right atrium and shows back-pressure changes identical to those seen in hepatic venous flow (18) (Fig 15). Distally, the cardiac activity has a lesser effect on flow velocities, and variations in thoracic or abdominal pressure cause greater variability in forward flow (18). In the common iliac veins, the flow pattern is more phasic, like that seen in the proximal lower limb veins (17).

http://radiographics.rsna.org/content/28/3/691.full


Normal spectral waveforms obtained in hepatic veins. (a) Spectrum from the middle hepatic vein in a 17-year-old girl shows normal a, S, v, and D waves from right atrial pressure changes. (b) Spectrum from the middle hepatic vein in a 1-month-old girl shows a normal monophasic flow pattern.

Most people have three hepatic veins: left, middle, and right. However, accessory hepatic veins are commonly observed. The hepatic veins join the inferior vena cava immediately inferior to the diaphragm and are in open communication with the right side of the heart (19). Flow in the hepatic veins is predominantly hepatofugal (away from the liver, toward the inferior vena cava) (20). The Doppler spectral waveforms from normal hepatic veins are multiphasic, similar to those obtained in the inferior vena cava and other large systemic veins (21). The waveform in the normal hepatic vein consists of two large antegrade waves (toward the heart) that represent atrial diastole and ventricular systole; a small retrograde wave (away from the heart) that represents flow during atrial systole; and a small wave between the two antegrade waves, which is produced by overfilling of the right atrium (19,21) (Fig 16a).

The monophasic flow pattern sometimes seen in neonates (Fig 16b) is normal and may be secondary to atypical hepatic compliance due to a large horizontally positioned liver or to hepatic hematopoietic activity (22). Variations in flow pattern among the veins have been reported. Flow in the middle hepatic vein has the most consistent triphasic pattern, probably because this vein is positioned at a favorable angle for Doppler US (22). There is no variation in triphasic activity after a meal (22).

http://radiographics.rsna.org/content/28/3/691.full


Normal spectral waveforms from different segments of the hepatic artery. (a) Spectrum from the hepatic artery at the porta hepatis in a 4-day-old girl demonstrates low-resistance and high-velocity diastolic flow. (b) Spectrum from the left branch of the hepatic artery in a 13-year-old boy shows lower resistance than that in a. The calculated RI also was lower.
The direction of blood flow in the hepatic artery is hepatopetal (toward the liver). Hepatic artery waveforms demonstrate low resistance and high diastolic flow velocities (Fig a). Normal hepatic arterial PSV in a fasting adult patient is approximately 30–40 cm/sec, and EDV is 10–15 cm/sec . The normal RI in a fasting patient varies from 0.55 to 0.81 (mean, 0.62–0.74). There is a consensus that the RI increases after a meal and also with age . The RI is higher at the porta hepatis (Fig a) and lower in vessel branches closer to the periphery of the liver (Fig b).
Spectral waveform from the portal vein in a 10-year-old boy shows a typical flow pattern, with fairly uniform velocity and slight phasic variations due to respiration and cardiac motion.

The direction of normal portal venous flow is hepatopetal. The flow velocity is fairly uniform, although slight variations may occur in the spectral line because of respiration (Fig ). Some degree of periodicity or pulsatility resulting from cardiac activity also has been observed in normal portal veins . The mean portal venous flow velocity in a fasting adult is approximately 18 cm/sec (range, 13–23 cm/sec) . The volume and velocity of portal venous flow normally increase after meals , reflecting the increased flow in the superior mesenteric artery . The splenic vein and the superior mesenteric vein show Doppler flow patterns similar to that of the portal vein.


http://radiographics.rsna.org/content/28/3/691.full


Normal spectral waveforms from renal arteries. (a) Spectrum from the midportion of the right renal artery in a 2-day-old girl demonstrates a prominent systolic peak, with antegrade flow throughout diastole. (b) Spectrum from an intraparenchymal renal artery in a preterm 26-day-old girl shows relatively high resistance (RI of 0.88), which is considered normal for preterm neonates.
Arterial flow in the main renal vessels and within the renal parenchyma demonstrates a prominent systolic peak, with antegrade diastolic flow present throughout the cardiac cycle (Fig ). The normal PSV in adults is 100–180 cm/sec, and the normal EDV is 25–50 cm/sec . The normal ratio of renal artery PSV to aortic PSV is less than 3.5 .
Spectrum from a normal renal vein in a 26-day-old girl shows continuous flow with minimal variations secondary to respiration and right atrial pressure changes.


http://radiographics.rsna.org/content/28/3/691.full
Spectrum from a normal intraovarian artery in an 11-year-old girl shows low-resistance flow and a low PSV.
In arteries in the ovary without the dominant follicle, there is a pattern of relatively high resistance, whereas in the active ovary, both during ovulation and during the formation of the corpus luteum, there is a pattern of low resistance with a continuous antegrade arterial flow throughout diastole .


http://radiographics.rsna.org/content/28/3/691.full


a-
b-

Spectra from intratesticular arteries in children. (a) Waveform obtained in a 12-year-old boy shows a normal low-resistance flow pattern. (b) Waveform obtained in a 2-month-old boy with a testicular volume of 0.7 cm3 shows higher resistance than in a, a finding considered normal in a child of this age. The calculated RI also was higher than that in a.
The spectral waveform produced by flow through the intratesticular arteries characteristically has a low-resistance pattern . The reported normal testicular values in healthy young adults are as follows: RI of 0.48–0.75 (mean, 0.62), PI of 0.7–2.3 (mean, 1.3), PSV of 4.0–19.5 cm/sec (mean, 9.7 cm/sec), and EDV of 1.6–6.9 cm/sec (Fig a). In prepubertal testicles (with a volume of less than 4 cm3), the diastolic arterial flow may not be detectable , and the RI tends to be higher than in pubertal and postpubertal testes (Fig b). These differences may be explained by vasodilatation and increased blood flow in mature testes .
Color Doppler US is useful for assessing bowel viability in patients with suspected or proved necrotizing enterocolitis . Bowel perfusion in normal neonates, as demonstrated at color Doppler US by using a velocity setting of 8.6 cm/sec, ranged from one to nine color dots per square centimeter . To our knowledge, no studies have been published about Doppler spectra in the setting of normal bowel vascularity. However, in our experience, both arterial (Fig a) and venous (Fig b) spectra may be obtained in the bowel wall.


a-
b-
Arterial (a) and venous (b) spectral waveforms obtained in the bowel wall of an 18-day-old girl show normal perfusion.

Friday, July 9, 2010

Normally the oblique entrance of the ureter through the bladder wall causes ureteric occlusion during bladder contraction. In VUR there is a structural abnormality of the intra-mural ureter allowing reflux of urine from the bladder to the kidney. CIN becomes established leading to further renal deterioration. By an uncertain mechanism, interstitial nephritis may cause focal scars and initiate a slowly progressive renal deterioration.

Diagnosis is confirmed by demonstration of focal renal scars (IVU or isotope renogram; ultrasound less reliable for this); will also reveal other abnormalities, e.g. obstruction. Urine culture necessary to show infection. Assess renal function, proteinuria etc. in usual way.

http://www.edrep.org/pages/textbook/reflux.php

Grade I - Reflux into the ureter only
Grade II - Reflux into the collecting system, without dilatation
Grade III - Reflux into the collecting system with mild dilatation, slight ureteral tortuosity, and no or slight blunting of the fornices
Grade IV - Moderate dilatation and/or tortuosity of the ureter and moderate dilatation of the renal pelvis and calyces, with complete obliteration of the sharp angle of the fornices but maintenance of the papillary impressions in the majority of calyces
Grade V - Gross dilatation and tortuosity of the ureter, with gross dilatation of the renal pelvis and calyces and nonmaintained papillary impressions


http://emedicine.medscape.com/article/414836-overview

Vesicoureteral reflux assessment and treatment algorithm.
Voiding cystourethrogram (VCUG) show a large, distended bladder with irregular and trabeculated margins. This patient had posterior urethral valves.


http://emedicine.medscape.com/article/414836-overview
Transverse sonogram in a boy with grade V vesicoureteral reflux and posterior urethral valves. Image demonstrates a thickened bladder wall.


http://emedicine.medscape.com/article/414836-overview
Nonenhanced CT scan in a 12-year-old boy demonstrates marked hydronephrosis and cortical thinning in a patient with grade V vesicoureteral reflux and a history of a posterior urethral valve. Note the free fluid in the pararenal space consistent with forniceal rupture after minor trauma to the abdomen (from football practice).


http:// emedicine.medscape.com/article/414836-overview
Nonenhanced CT scan at a level just above ureteral insertion demonstrates bilateral, markedly dilated ureters in a patient with grade V vesicoureteral reflux.


http://emedicine.medscape.com/article/414836-overview
Dimercaptosuccinic acid (DMSA) scans demonstrate photopenia at the right superior pole consistent with scarring in this patient with vesicoureteral reflux.


http://emedicine.medscape.com/article/414836-overview
Nuclear cystograms demonstrate grade III reflux. Reflux to the left kidney is shown, with dilatation of the renal pelvis.


http:// emedicine.medscape.com/article/414836-overview
Unilateral grade V vesicoureteral reflux secondary to a posterior urethral valve. There is gross dilatation of the renal pelvis and calyces. Papillary impressions are not visible. Gross intrarenal reflux is also identified.


http://emedicine.medscape.com/article/414836-overview
Voiding cystourethrogram (VCUG) demonstrates a tortuous, dilated ureter in a patient with grade V vesicoureteral reflux.


http://emedicine.medscape.com/article/414836-overview
Voiding cystourethrogram (VCUG) of the left kidney demonstrates grade V vesicoureteral reflux.


http://emedicine.medscape.com/article/414836-overview
Voiding cystourethrogram (VCUG) demonstrates high-grade IV vesicoureteral reflux in a patient with a duplicated collecting system.


http://emedicine.medscape.com/article/414836-overview
Voiding cystourethrogram (VCUG)demonstrates bilateral grade III vesicoureteral reflux


http://emedicine.medscape.com/article/414836-overview
Voiding cystourethrogram (VCUG) of lower ureter and ureterovesical junction in a patient with grade III reflux. The ureteral insertion on the left is between the 3- and 6-o'clock positions. There is a small bladder diverticulum at the ureteral insertion.


http://emedicine.medscape.com/article/414836-overview
Voiding cystourethrogram (VCUG) demonstrates bilateral grade III reflux. The renal pelvis is mildly dilated on the right. There is some mild blunting of the calyceal fornices and loss of papillary impressions in the upper poles bilaterally.


http://emedicine.medscape.com/article/414836-overview
Grade II vesicoureteral reflux in a patient with ureteral duplication.


http://emedicine.medscape.com/article/414836-overview

Voiding cystourethrogram (VCUG) demonstrates grade II VUR into the upper-pole moiety of a duplex collecting system and grade III VUR to the lower-pole moiety.
Voiding cystourethrogram (VCUG) shows grade I left VUR. Incidentally noted is vaginal reflux.


http://emedicine.medscape.com/article/414836-overview
Voiding cystourethrogram (VCUG) demonstrates a posterior urethral valve.


http://emedicine.medscape.com/article/414836-overview