Clinical photographs show transducer placement for imaging of the hepatic vasculature. Depending on which vessels are being evaluated, the transducer can be placed in a transabdominal (a), subcostal (b), or intercostal (c) location.
 the world of radiology is the world of magic and gessing


 Aliasing of the spectral waveform. Duplex US image shows aliasing of the spectral waveform with wraparound of the highest flow velocities into the negative part of the graph. Note that the color Doppler flow US image shows normal antegrade portal venous flow with no aliasing. To eliminate or reduce this artifact, spectral Doppler US must be active before different parameters can be modified.
 Changing the color baseline to avoid aliasing. (a) On a color Doppler flow US image, flow within the portal vein appears green, the color equivalent of aliasing on the selected color bar. The color baseline (arrow) is positioned too high on the color bar. Although the US image helps confirm the presence of flow, the baseline should be lowered to obtain meaningful directional flow data. (b) On a color Doppler flow US image obtained after the baseline was lowered (arrow), accurate directional flow data have been obtained from the main portal vein: Appropriate antegrade portal venous flow toward the transducer appears red.
 Changing the spectral baseline to avoid aliasing. (a) Duplex US image demonstrates aliasing of the spectral waveform, which results in the production of inaccurate waveform data and an inability to obtain accurate quantitative flow data. (b) On a duplex US image obtained after the spectral baseline was lowered, the spectral waveform falls within the range of velocities being evaluated, so that accurate quantitative data can be obtained. Note that changing the baseline does not change the velocity scale (PRF = 1,515 Hz), making this adjustment a logical initial change when reducing aliasing.
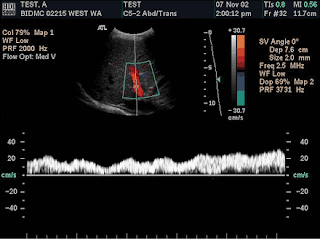 Adjusting the spectral scale. (a) Color duplex US image demonstrates that when the spectral scale (or the sampling rate) is set too high (in this example, PRF = 14,286 Hz), flow is more difficult to appreciate and characterize on the scale. (b) On a color duplex US image obtained after the scale was reduced (PRF = 3,731 Hz), the range of depicted velocities is reduced and the appearance of the spectral waveform is improved, providing more visible quantitative and qualitative data. Note that the color Doppler flow US image, color bar, and color scale all remain unchanged because the spectral component is active.

 Adjusting the color velocity scale. (a) Color Doppler flow US image obtained with the color velocity scale set too high (69.2 cm/sec) demonstrates apparent absence of flow in the portal vein. (b) Color Doppler flow US image obtained after the scale was reduced to 30.7 cm/sec demonstrates normal flow in a widely patent portal vein. (c) Color Doppler flow US image obtained after the scale was set even lower (2.3 cm/sec) shows aliasing of color flow in all branches of the portal vein, which results in meaningless data concerning flow direction. Thus, the color velocity scale should be increased to increase the sampling rate.