Figures 1, 2. Axial T2-weighted fast spin-echo images (5,000/128) obtained at different levels, with two signals averaged, 6-mm section thickness, echo train of 23, and 230 × 512 matrix. T2-weighted images are frequently unable to help differentiate between acute and old lesions.

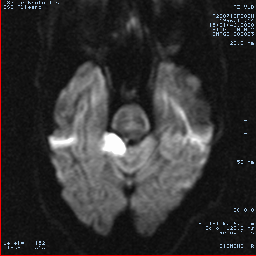
Figures 3, 4. Axial diffusion-weighted (z sensitizing direction) multishot echo-planar images (800/123) corresponding to Figures 1, 2, obtained with one signal acquisition and 6-mm section thickness. The recent infarction in the left caudate nucleus (3) and in the cerebellum (4) is easily recognized.

Figures 3, 4. Axial diffusion-weighted (z sensitizing direction) multishot echo-planar images (800/123) corresponding to Figures 1, 2, obtained with one signal acquisition and 6-mm section thickness. The recent infarction in the left caudate nucleus (3) and in the cerebellum (4) is easily recognized.


Old Infarction
Five to 10 days after acute infarction, the reduced values (by an average of about 50%) of the apparent diffusion coeficient (ADC) will increase above normal values. On diffusion-weighted images, this is caracterized by a "flip-flop" from hyperintense lesion to iso/hypointense lesion. On ADC maps, the lesion becomes iso/hyperintense (and therefore more conspicuous). This behavior is useful in the following situations:
In patients with multiple ischemic lesions, T2-weighted imaging is frequently unable to help differentiate between acute and old lesions
A new extension of a previous ischemic lesion is frequently difficult to identify on T2-weighted images
No comments:
Post a Comment